Petra Vaiglova
Australian National University
In a recent study, I led a team of biologists, archaeologists and geochemists in a quest to understand the social mechanisms that underpinned ritual feasting at the Early Neolithic site of Asiab in western Iran (Vaiglova et al., 2025). We used a technique that had been applied time and time again for probing seasonal mobility patterns of past animals: the analysis of sequential tooth enamel stable oxygen isotope values and strontium isotope ratios. But, the way we went about obtaining our measurements was very different from previous studies. Instead of removing powdered enamel from the surface of teeth at approximately 1mm-wide intervals (e.g., Balasse, 2002; Vaiglova et al., 2018), we used microscopic growth patterns inside the teeth to guide our analyses.
Using finely polished ground sections (see Figure 6), we measured the number and thickness of daily growth increments inside each wild boar tooth and used this information to analyse the isotopic composition at locations corresponding approximately to weekly-spaced intervals of enamel secretion. Because the daily rate of enamel secretion (in µm per day) decreases over the course of a tooth’s formation, we adjusted the spacing between individual measurements so that they got progressively smaller across the tooth’s growth trajectory. Although the chemical composition of enamel that is secreted along these daily growth increments is not frozen in time—it gets overprinted to a certain degree during the later phase of enamel maturation (Green et al., 2025)—this sampling strategy provided us with the highest possible temporal resolution of the incrementally forming enamel.
This approach for using the structure of teeth (histology) to guide in situ geochemical analyses had previously been applied to teeth belonging to humans and non-human primates (e.g., Green et al., 2022; Smith et al., 2018; Vaiglova et al., 2024). Our study was the first time it was adapted for analysing teeth from a zooarchaeological assemblage. The result was that it provided us with an unprecedented amount of detail: 165 stable oxygen isotope values and 107 strontium isotope ratios from just five wild boar teeth, representing subtle changes in the animals’ water and food intake during the time of molar development. These intra-tooth sequences are less averaged than sequences obtained using drill holes that cut across unknown (and varying) amounts of daily growth increments. As a result, they provide closer approximations of the shape and amplitude of seasonal patterns of isotopic inputs.
The high-resolution sequences enabled us to propose that although Asiab was located in a landscape hospitable to wild boars, the animals that were used at the site for ritual feasting during the Early Neolithic were most likely sourced from distinct locations. Some of those locations were likely situated at large distances from the site; possibly over 70 km away. What this implied on a human level for the organisation of the feasting activities was beautifully depicted in an illustration created by Kathryn Killackey (Figure 7).
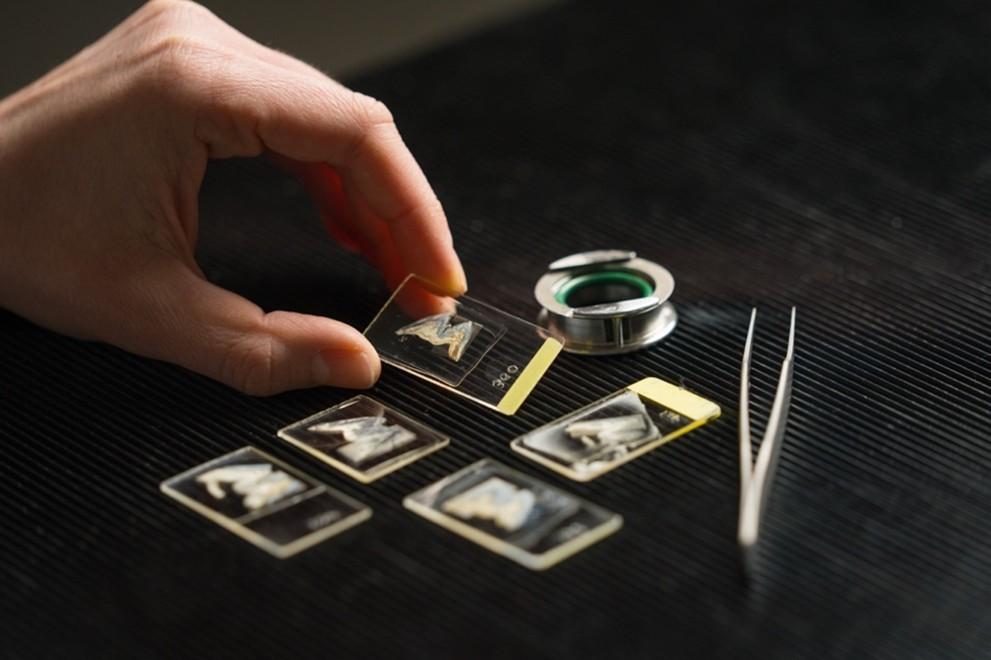
Figure 6. Photograph showing the 50 µm thick ground sections extracted from the study teeth. Each tooth was sectioned at a location that was optimal for counting and measuring daily growth increments preserved inside the enamel. In the sample that is raised, the enamel region appears white, while the dentine appears beige. Photo credit: Nic Vevers, Australian National University Press Office. Used with permission.
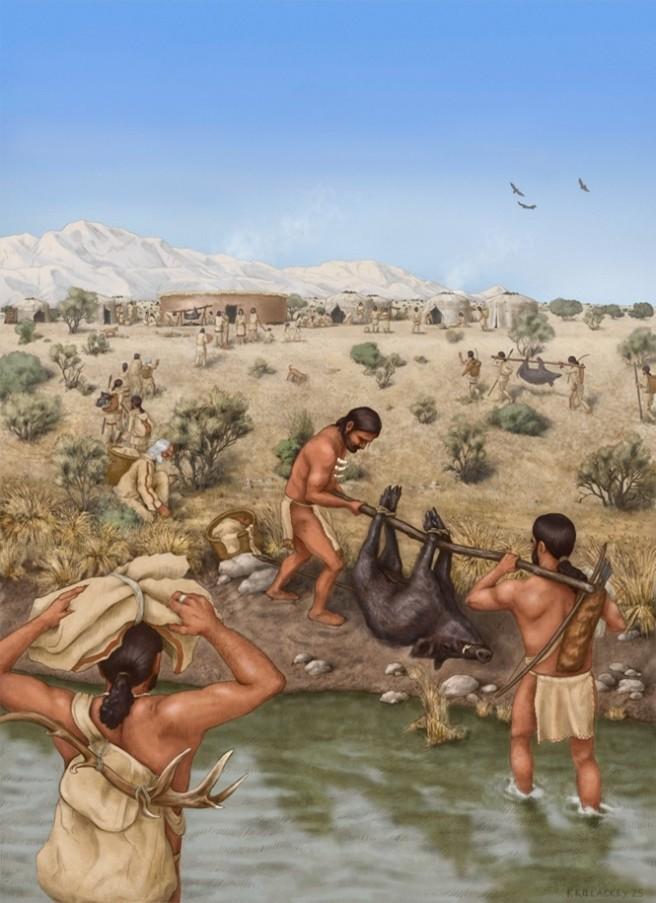
Figure 7. Artist Kathryn Killackey’s depiction of the findings of our study. The illustration shows groups of people transporting wild boars to Asiab across the Zagros Mountains landscape, replete with archaeologically documented details such as the use of necklaces made of boar canines. See the last section in Vaiglova and Killackey (2025) for Kathryn’s insights into the creative process that went into crafting such a complex and archaeologically detailed image. Used with permission.
The public response to our publication was exciting. The news of our findings was communicated across several media platforms, with our favourite headline written by Kristina Killgrove from LiveScience: “Archaeologists discover that parties 11,000 years ago were BYOB – Bring Your Own Boar”. The enthusiasm about the findings even spurred a meme based on The Simpsons that was shared on social media and which read “Come to Homer’s BBBQ. The extra B is for Bring Your Own Boar.”
Against the backdrop of all this excitement, it is important to remember that the role of science is not to serve the scientist. It is an endeavour that should be repeated. Scientists thus have the responsibility to make their methods fully reproducible; especially when introducing cutting-edge techniques. The combination of methods we used (Figure 8) required lengthy procedures to section the teeth at the optimal locations, prepare ground sections that were thin enough to show the daily growth increments, count and measure the growth increments, and place the analytical spots at desired locations with micrometre accuracy. However, if we simply stated in our Methods that we used histological information to target geochemical analyses at ~weekly resolution without describing what the histological data look like and how it can be translated into a sampling strategy on the instrument used, others would not be able to independently reproduce our methods. For this reason, we went to extra lengths to create transparency in relation to the application of our methods.
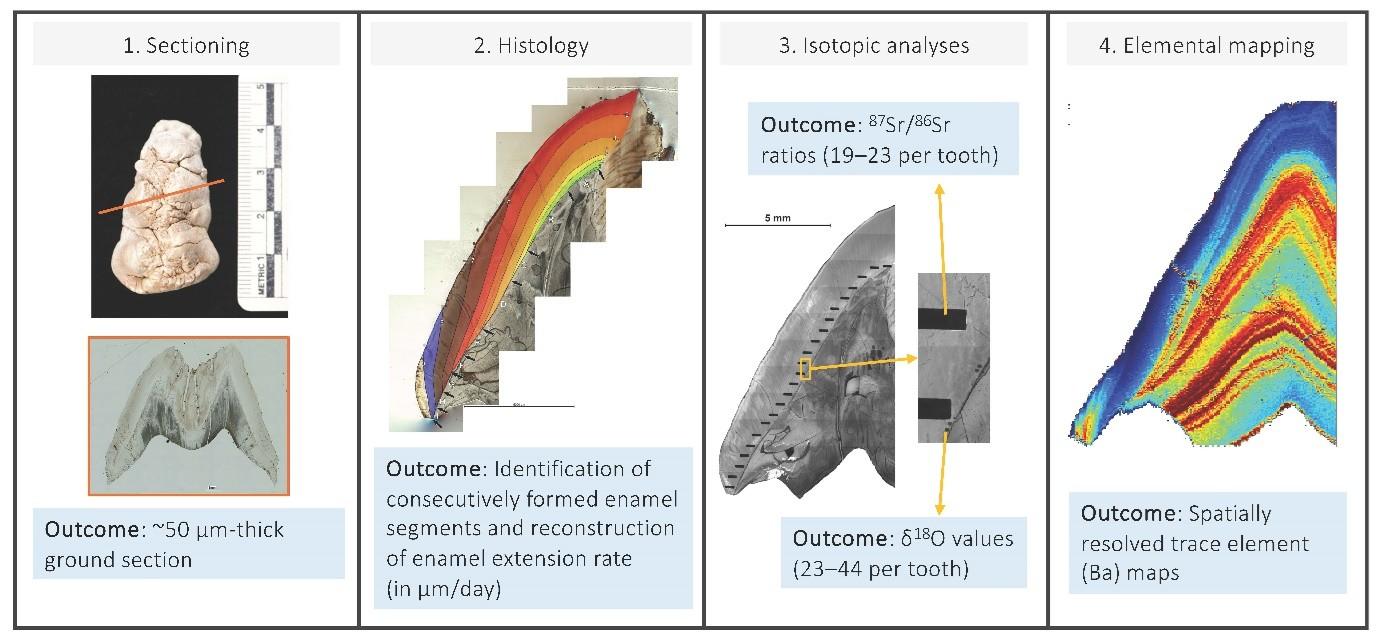
Figure 8. A schematic showing the sequence of methods we used to assess the provenance of wild boars recovered from a feasting deposit at Asiab. The placement of analytical spots for isotopic analyses (stable oxygen isotope values and strontium isotope ratios) discussed in this article is shown in panel 3. Reproduced from Vaiglova et al. (2025). Used with permission.
We provided all the raw histological data, accompanied by microscope images showing what the daily growth increments look like. For an example, see Figure 9. We supplied annotated images of each ground section and described how distinct enamel growth segments were used to calculate the histological measurements. See Figure 10. Because the growth increments are not visible on the camera inside the instrument used for isotopic analysis, we described how the enamel extension rate and length of the enamel dentine junction within each growth segment could be used to determine placement of the analytical spots at the desired resolution. This had to take into account that the growth segments did not necessarily align with the end of a week, and an offset was thus needed to calculate where to place the first spot within each growth segment. To enable others to see where the analytical spots landed, we took microscope images of each ground section after the isotopic analyses were completed. Because the images were too large to submit as supplementary materials, we uploaded them to the Open Science Framework.
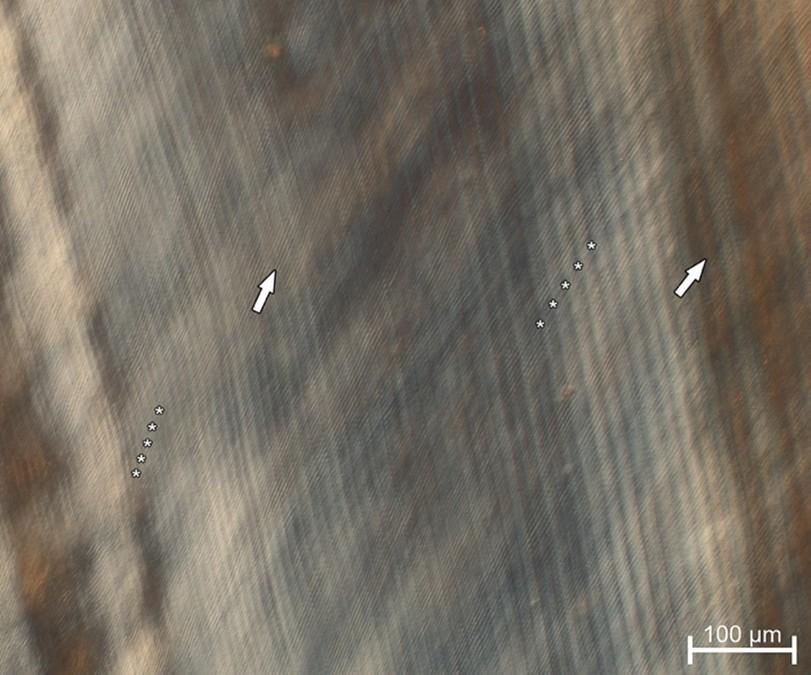
Figure 9. Microscope image of the internal enamel structure of a wild boar tooth (ASB402, upper third molar). Arrows indicate the direction of enamel prisms, asterisks mark daily growth increments (laminations). This image is reproduced from Supplementary Materials in Vaiglova et al. (2025). Used with permission.
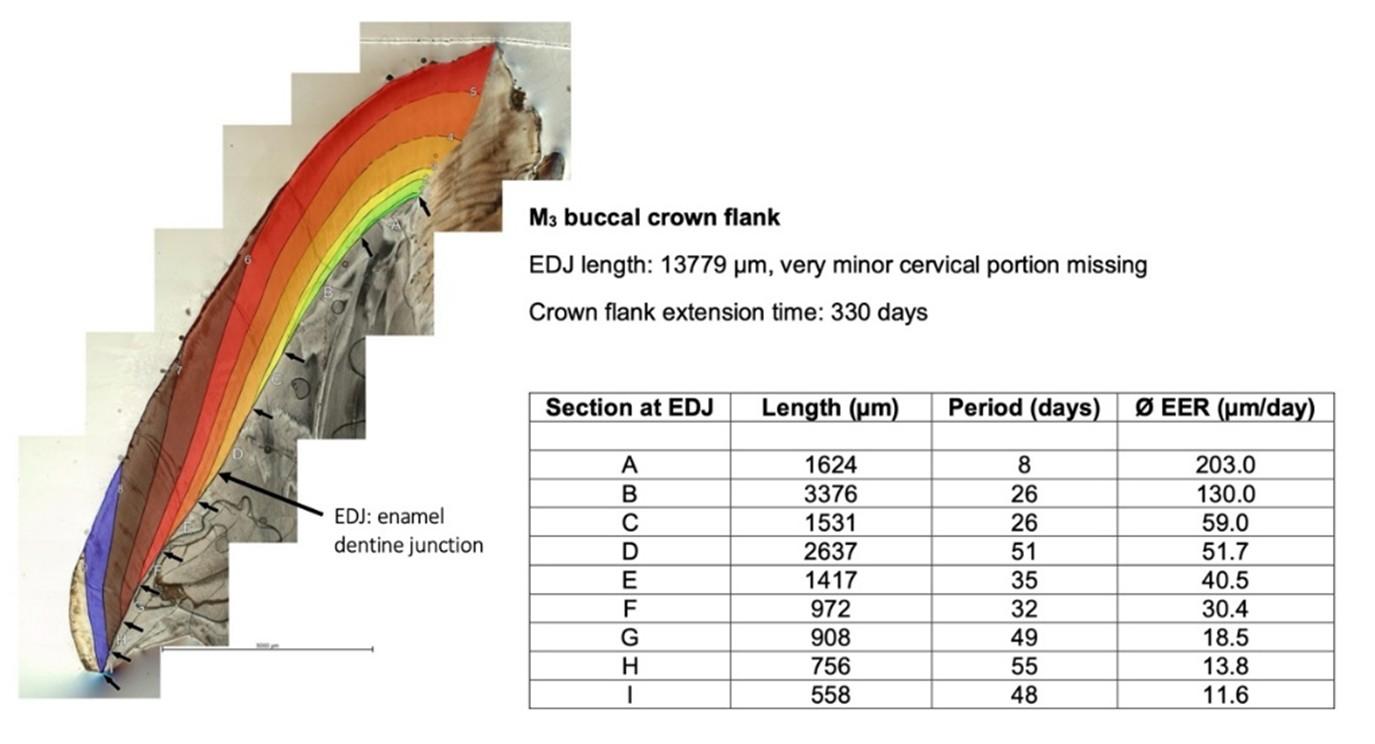
Figure 10. Annotated ground section from wild boar tooth ASB133 (lower third molar). The coloured regions overlaying the enamel portion of the ground section show distinct growth segments (labelled A through I) that were used for histological analysis. The Enamel Extension Rate (in µm per day) was calculated by dividing the length of the enamel dentine junction (in µm) by the number of days each growth segment took to form. In this tooth, we can see that the enamel extension rate decreases over the course of the tooth’s development. It starts with 203 µm of enamel deposited daily and ends with 11 µm of enamel deposited daily. Reproduced from Supplementary Materials Vaiglova et al. (2025). Used with permission.
Assessment of the reliability of each in situ stable oxygen isotope measurement required a certain level of subjectivity. This is because we were trying to place the analytical spots as close to the enamel dentine junction as possible without touching it. If it touched, the measurement would no longer reflect the composition of only the enamel. However, the visibility on the camera inside the instrument sometimes made it difficult to determine whether the 20 µm-wide analytical spots cleared the EDJ or not (for further discussion, see our behind-the-paper blog post on Nature Springer Research Communities, Vaiglova and Killackey, 2025). Overall, we determined that 13 analytical locations provided unreliable measurements. For full transparency, we created a Reproducibility Index that contains the images of every analytical spot taken on the camera inside the instrument; a total of 200 images. For an excerpt, see Figure 11; or access the full Index on the Open Science Framework. This way, anyone can re-assess our quality control decisions, re-do our analyses with the data points they deem reliable, and reproduce our published figures using the shared code if they wish.
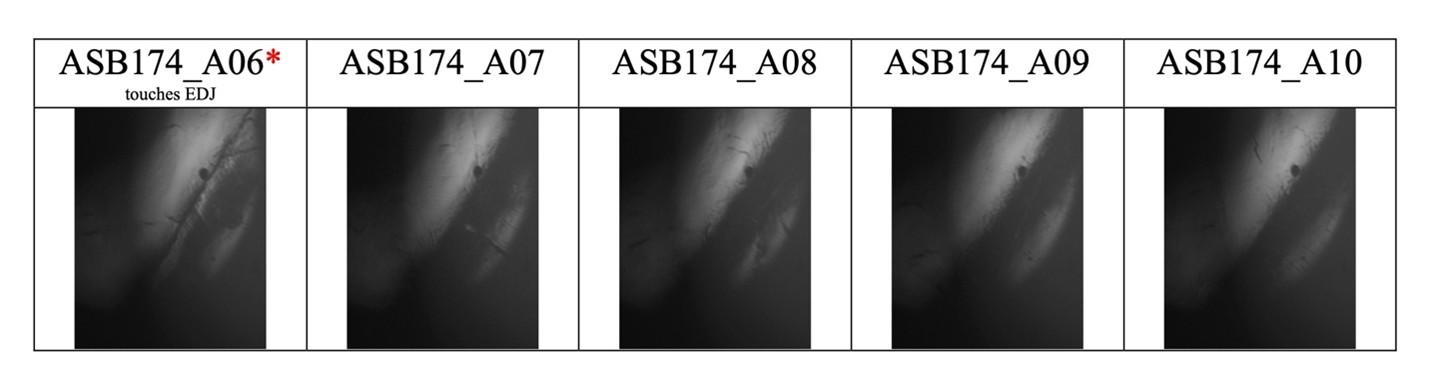
Figure 11. An excerpt from the Reproducibility Index created to catalogue all the analytical spots taken with a camera inside the Sensitive High Resolution Ion Microprobe (SHRIMP). The full document can be downloaded from the Open Science Framework. In the images shown here, the enamel dentine junction (EDJ) appears as a thin line running from the upper right corner to the lower left corner. The analytical ‘burn spot’ is visible as a circle (⌀ 21µm) in the upper right quadrant. Here, it was determined that sample A06 touched the EDJ and its composition was thus compromised. Reproduced from Supplementary Materials in Vaiglova et al. (2025). Used with permission.
However, achieving high-resolution measurements does not necessarily guarantee good science. Good science will always be constrained by the types of questions we ask and the approaches we use for analysing the results. A lot has been written about the importance of thoughtfully integrating statistical thinking into every step of the research cycle. I have summarised what I consider to be the most important advice in a paper on improving statistical training in archaeology (Vaiglova, 2025). In this paper, I suggest that a good place to start is to talk about five elephants in the room, five statistical concepts that we do not talk about enough. See Figure 12. A more concentrated effort to discuss these concepts in the classroom, in supervision meetings, in research workshops and during course design will not only make it easier to adapt good statistical practice. It will also shield us from falling victim to common misuses of statistical tools, particularly null hypothesis significance testing (NHST).
Professional statisticians have been warning us for decades that null hypothesis falsification—the approach that underlies statistical tests like t tests and analysis of variance, ANOVA—does not necessarily provide the information we may think it provides. Jacob Cohen, one of the most influential statisticians of the 20th century, wrote in this regard:
“What's wrong with NHST? Well, among many other things, it does not tell us what we want to know, and we so much want to know what we want to know that, out of desperation, we nevertheless believe that it does!” (Cohen, 1994, p. 997)
A critical problem with significance testing is not the use of p values per se. It is the misplaced use of deductive logic—if a hypothesis H predicts observation O, but observation O does not happen, H must be false—in a world where most of the phenomena we are interested in are not binary. Rejecting a null hypothesis should not have only one possible outcome (the presence of an effect) because any given hypothesis may correspond to more than one explanatory model. Conversely, any explanatory model may correspond to more than one hypothesis. For a thorough and easily digestible discussion on this topic, see Chapter 1 (or the related YouTube lecture) from Richard McElreath (2018). It is no surprise then that McElreath argues that “The greatest obstacle that I encounter among students and colleagues is the tacit belief that the proper objective of statistical inference is to test null hypotheses.” (McElreath 2018, p. 4)
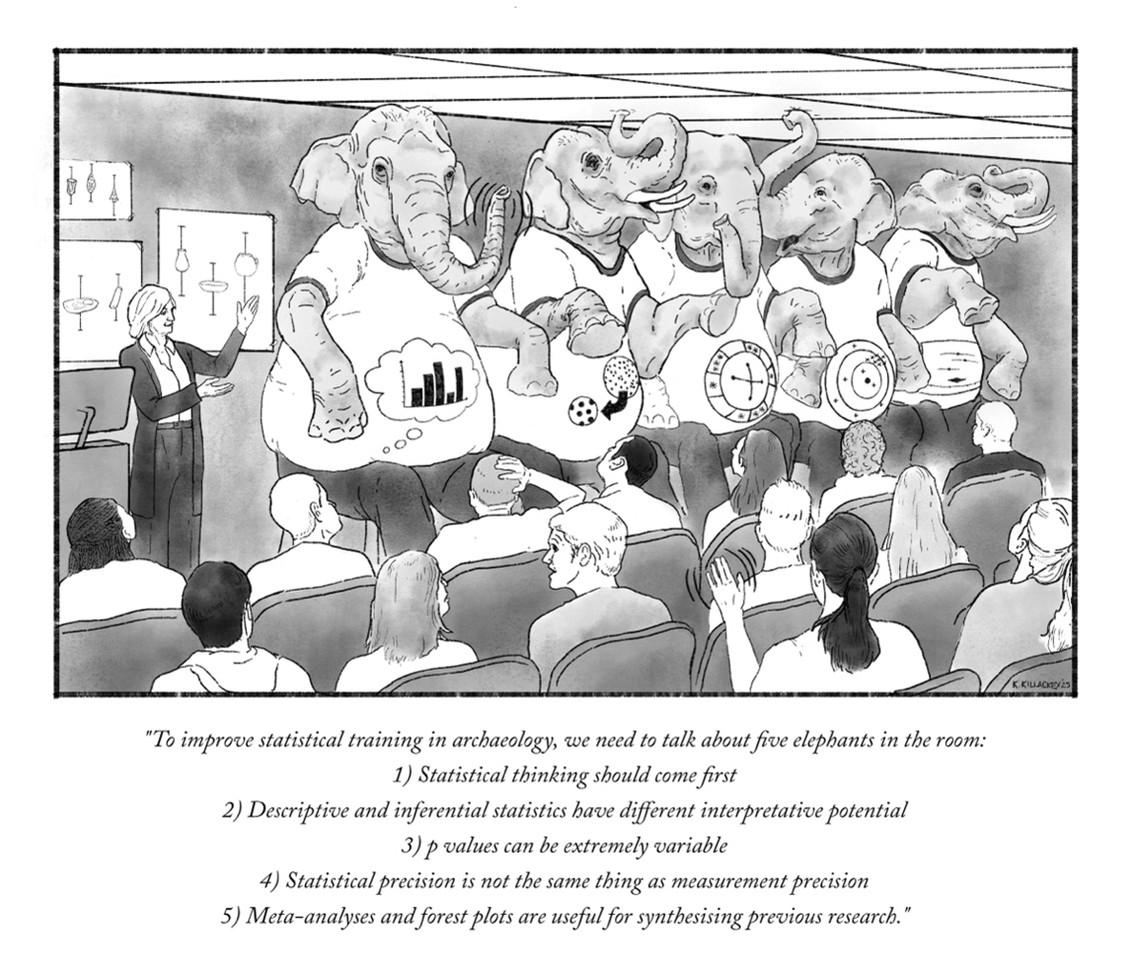
Figure 12. Graphical abstract that accompanies the publication ‘How can we improve statistical training in archaeology?’ (Vaiglova 2025). Drawing by Kathryn Killackey. The cartoon illustrates five statistical elephants in the room (statistical concepts we do not talk about enough). In the article, I argue that by shining a light on these elephants, we can both strengthen statistical training and avoid falling victim to common misuses of statistical tools (particularly statistical tests). Used with permission.
One way to avoid following the commonly misused approach of null hypothesis falsification is to reframe dichotomous questions (e.g., Did male burials contain more grave goods than female burials?) as estimation questions (e.g., To what extent did male and female burials differ?) (Cumming, 2012; Vaiglova, 2025). Estimation thinking leads to more informative and contextualised insights than simple yes/no answers. It requires us to describe what the data (and the uncertainty around the data) tells us about the phenomenon of interest. Importantly, it leads us to consider how large an effect must be to be meaningful in a given research context. This is more informative than simply stating that there is a statistically significant difference between groups.
In our study of five wild boars, we wanted to assess whether the study animals all spent their developmental years in the same geographic region. We could have taken the measured isotopic sequences and ran a test to see if there is a statistically significant difference between the five individuals. But this would not have been very revealing. What we did instead was notice that one of the individuals (ASB449) exhibited lower stable oxygen isotope values (δ18O) compared to the other four individuals (ASB133–402). To assess whether this difference was meaningful enough to suggest that the animals originated from distinct locations, we calculated the difference between the δ18O values of the two groups and expressed it along with the uncertainty around the difference. This way, our readers would not have to take our declaration of difference for granted. We wrote:
“the difference in δ18O values between ASB449 and ASB133–402 is sufficiently large ((mean of ASB133–402, n = 167) – (mean of ASB449, n = 88) = 2.8‰, 95% CI [2.5, 3.1]) to indicate that the animals spent crown formation time in distinct regions” (Vaiglova et al., 2025, p. 4)
The 95% confidence interval (CI) around the difference told us that the phenomenon we were trying to quantify—the real difference between the δ18O value of the two groups—was most likely captured by the interval 2.5 – 3.1 ‰. Even on the lower end of this interval, this difference is something we could interpret as meaningful.
Researchers do not have to explicitly state that they are using estimation thinking to do good research. The point is that providing estimates is more meaningful and informative than making declarations about whether a test passed an arbitrary threshold (like p < 0.05). While there are many approaches to statistical inference—and professional statisticians do not always agree on which approach(es) should be used—our best bet is to let the research context (rather than a black box) drive the interpretation. In this light, I like to think of the benefit of high-resolution isotopic analyses as more than an approach to collect better data. It’s an opportunity to ask better estimation questions!
Bibliography
Balasse, M., 2002. Reconstructing dietary and environmental history from enamel isotopic analysis: time resolution of intra-tooth sequential sampling. International Journal of Osteoarchaeology 12, 155–165. https://doi.org/10.1002/oa.601
Cohen, J., 1994. The earth is round (p < .05). American Psychologist 49, 997–1003. https://doi.org/10.1037/0003-066X.49.12.997
Cumming, G., 2012. Understanding the New Statistics: Effect Sizes, Confidence Intervals, and Meta-Analysis. Roudledge, New York.
Green, D.R., Ávila, J.N., Cote, S., Dirks, W., Lee, D., Poulsen, C.J., Williams, I.S., Smith, T.M., 2022. Fine-scaled climate variation in equatorial Africa revealed by modern and fossil primate teeth. Proceedings of the National Academy of Sciences 119, e2123366119. https://doi.org/10.1073/pnas.2123366119
Green, D.R., Smith, T.M., Olack, G., Williams, I.S., Tafforeau, P., Colman, A.S., Uno, K.T., 2025. How teeth record and attenuate seasonal signals. Journal of Archaeological Science 175, 106148. https://doi.org/10.1016/j.jas.2024.106148
McElreath, R., 2018. Statistical rethinking: a Bayesian course with examples in R and Stan, 2nd edition. ed. CRC Press.
Smith, T.M., Austin, C., Green, D.R., Joannes-Boyau, R., Bailey, S., Dumitriu, D., Fallon, S., Grun, R., James, H.F., Moncel, M.-H., Williams, I.S., Wood, R., Arora, M., 2018. Wintertime stress, nursing, and lead exposure in Neanderthal children. Science Advances 4, eaau9483.
Thomas, D.H., 1978. The Awful Truth about Statistics in Archaeology. Am. Antiq. 43, 231–244. https://doi.org/10.2307/279247
Vaiglova, P., 2025. How can we improve statistical training in archaeological science? Journal of Archaeological Science 179, 106220. https://doi.org/10.1016/j.jas.2025.106220
Vaiglova, P., Ávila, J.N., Buckley, H., Galipaud, J.C., Green, D.R., Halcrow, S., James, H.F., Kinaston, R., Oxenham, M., Paz, V., Simanjuntak, T., Snoeck, C., Trinh, H.H., Williams, I.S., Smith, T.M., 2024. Past rainfall patterns in Southeast Asia revealed by microanalysis of δ18O values in human teeth. Journal of Archaeological Science 162, 105922. https://doi.org/10.1016/j.jas.2023.105922
Vaiglova, P., Halstead, P., Pappa, M., Triantaphyllou, S., Valamoti, S.M., Evans, J., Fraser, R., Karkanas, P., Kay, A., Lee-Thorp, J., Bogaard, A., 2018. Of cattle and feasts: Multi-isotope investigation of animal husbandry and communal feasting at Neolithic Makriyalos, northern Greece. PLoS ONE 13, e0194474. https://doi.org/10.1371/journal.pone.0194474
Vaiglova, P., Kierdorf, H., Witzel, C., Falster, G., Joannes-Boyau, R., Wang, Y., Wu, J., Williams, I., Knowles, B., Wu, Y., Bangsgaard, P., Yeomans, L., Richter, T., Darabi, H., 2025. Transport of animals underpinned ritual feasting at the onset of the Neolithic in southwestern Asia. Commun Earth Environ 6, 1–12. https://doi.org/10.1038/s43247-025-02501-z
Vaiglova, P., Killackey, K., 2025. Making cutting-edge archaeological science accessible to others’. URL https://communities.springernature.com/posts/being-cutting-edge-is-not-enough-we-need-to-invest-time-into-making-cutting-edge-methods-accessible-to-others
Go back to top